One of the biggest challenges for me when I teach and when I do research is to ensure that what I am trying to explain can be clear. What I often do is abstract (and extract) the main concepts within each article and then build a comparative table that serves as an organizing framework (see for example my previous post on highlighting and engaging with printed material like journal articles and book chapters).
To provide an example of how I organize concepts using tables, here is how I presented different approaches to regional development in Mexico. In these readings, I wanted my students to see different strategies of regional development that were being used in Mexican case studies, and what were the main advantages, disadvantages, learning insights, etc. The citations for this week’s readings are below.
Week 4 (Sep 7th, 9th) Regional development theories II: Case studies in Mexico from transnational firms, tourism, migrants and science and technology policies
Jimenez Almaguer, Karla Paola, Jose Melchor Medina Quintero, and Nazlhe Faride Chein Shekaiban. 2013. �The Search for the Development of Clusters in Tamaulipas, Mexico: A Case Study.� Econom�a: Teor�a y Pr�ctica (39): 89�117.
Corona, Juan Manuel, Gabriela Dutr�nit, Mart�n Puchet, and Fernando Santiago. 2014. �Science, Technology and Innovation Policies for Development.� In Science, Technology and Innovation Policies for Development, eds. Gustavo Crespi and Gabriela Dutr�nit. Geneva, Switzerland: Springer International Publishing, 15�43.
Carrillo, Jorge. 2004. �Transnational Strategies and Regional Development: The Case of GM and Delphi in Mexico.� Industry and innovation 11(1/2): 127�53.
Delgado Wise, Raul, and H�ctor Rodr�guez Ram�rez. 2001. �The Emergence of Collective Migrants and Their Role in Mexico�s Local and Regional Development.� Canadian Journal of Development Studies XXII(3): 1�18.
Once I chose the readings I decided to systematize them in a table so that the main insights I wanted them to gain from the readings were easy to read across all four readings. I used main categories in the rows, and each case study in the columns. My summary table for those learning points is posted below.
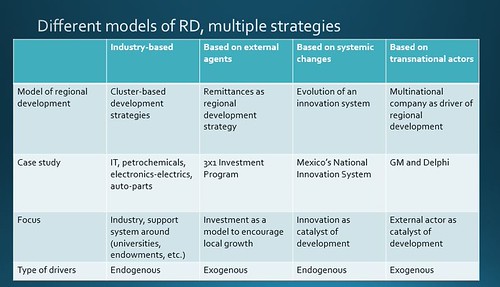
As you can see, I chose four different readings where each one of them offered insight into one particular type of regional development strategy. I purposefully selected readings where the industries analyzed were different across, and where the main conceptual paradigm was different as well. Two of the case studies present exogenous forces and two case studies present endogenous development. This was also a deliberate and purposeful decision.
Overall, I find that tables are organizing devices that require us to think in pretty abstract ways, but also give us insight into how we can analyze data more systematically. I use tables not only in my research but also in my teaching.

0 Responses
Stay in touch with the conversation, subscribe to the RSS feed for comments on this post.